 WASHINGTON — The U.S. Department of Agriculture in its November Livestock, Dairy and Poultry Outlook made substantial revisions to its 2018 and 2019 dairy herd forecasts, lowering the expected herd size from the October forecast and from the prior year. Still, annual milk production is expected to increase in both 2018 and 2019, and average prices for fluid milk and key dairy products are expected to partially recover from lower average values for 2018.
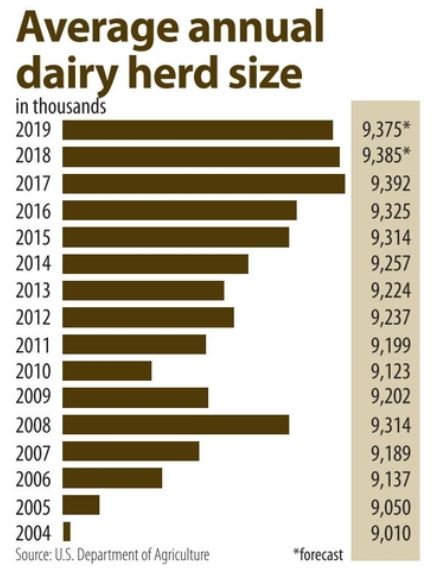
The U.S.D.A. forecast the annual dairy cow herd in 2018 at an average of 9,385,000 head, down 15,000 head from the October forecast and down 7,000 head from 2017, with the average herd size in 2019 forecast at 9,375,000 head, down 35,000 from October and down 10,000 from 2018. If realized, 2018 will see the first year-over-year decline in the average size of the dairy herd since 2013.
At the same time, the U.S.D.A. forecast average milk output per cow to increase in both years to records of 23,210 lbs in 2018 and 23,565 lbs in 2019. Production per cow has increased annually since 2001, when it dropped 35 lbs from the prior year to 18,162 lbs. Milk per cow was expected to increase this year and next as lower-producing cows are culled, leaving the most efficient cows in production.
The U.S.D.A.’s latest Milk Production report showed the number of dairy cows was above year-earlier levels for every month through June, was even in July and fell below monthly year-ago levels in August, September and October. Milk per cow was above year-ago levels every month through October, as was monthly milk production. Milk output through the first three quarters of 2018 was up 1.1% from the same period last year, with production for the year forecast at 217.9 billion lbs, up 1.1%. Total milk production in 2019 was forecast at 220.9 billion lbs, up 1.4% from 2018.
 Recent prices for most dry dairy products have been gradually increasing and were above year-ago levels at the end of November. Dry whey and lactose prices have nearly doubled from lows posted early in the year and were up 56% and 63%, respectively, from a year ago. The price of 34% whey protein concentrate was up 35% from March lows and was up 20% from a year ago, while dry buttermilk was up 40% from its March low and was up 9% from a year ago. All four products were at 2018 highs. Nonfat dry milk prices were up 13% to 28% year-over-year, depending on grade and region.
CME Group butter prices have traded mostly in the $2.20 to $2.30 per lb range since March and were up slightly from a year ago, but as November ended were down 7% from a 2018 high near $2.41 per lb set in May.
Cheese prices, meanwhile, have seen considerable fluctuation and were down from year-ago levels. CME Group cheddar cheese prices were down about 13% at the end of November. The U.S.D.A. said in its November Outlook the price spread between CME Group 40-lb blocks and 500-lb barrels was record wide at the end of October but narrowed in November. Barrel cheddar tends to be used to make processed cheese.
“A wide block-barrel spread contributes to considerable uncertainty in cheese markets,” the U.S.D.A. said, as CME Group cheddar prices typically lead U.S.D.A.-quoted prices by a couple of weeks.
While seemingly always challenged, the dairy industry has experienced a rollercoaster year. Average milk prices were forecast to drop 8% from 2017 due to lower component prices, with average prices for butter down 3% from 2017, cheddar cheese down 6%, nonfat dry milk down 8% and dry whey down 23%, according to the U.S.D.A. Meanwhile, dairy product exports have seesawed amid tariff issues with China and Mexico, with the former possibly easing after the latest talks between the leaders of the United States and China and the latter calmed by the signing of the United States Mexico Canada Agreement at the end of November. Possibly 2019 will be a better year for dairy producers, if higher U.S.D.A. price forecasts prove accurate.