WASHINGTON — The U.S. Department of Agriculture, in its March 29 annual Prospective Plantings report, said farmers in 2019 intend to plant 4% more acres of corn than a year ago, 5% fewer acres of soybeans and 4% fewer acres of wheat.
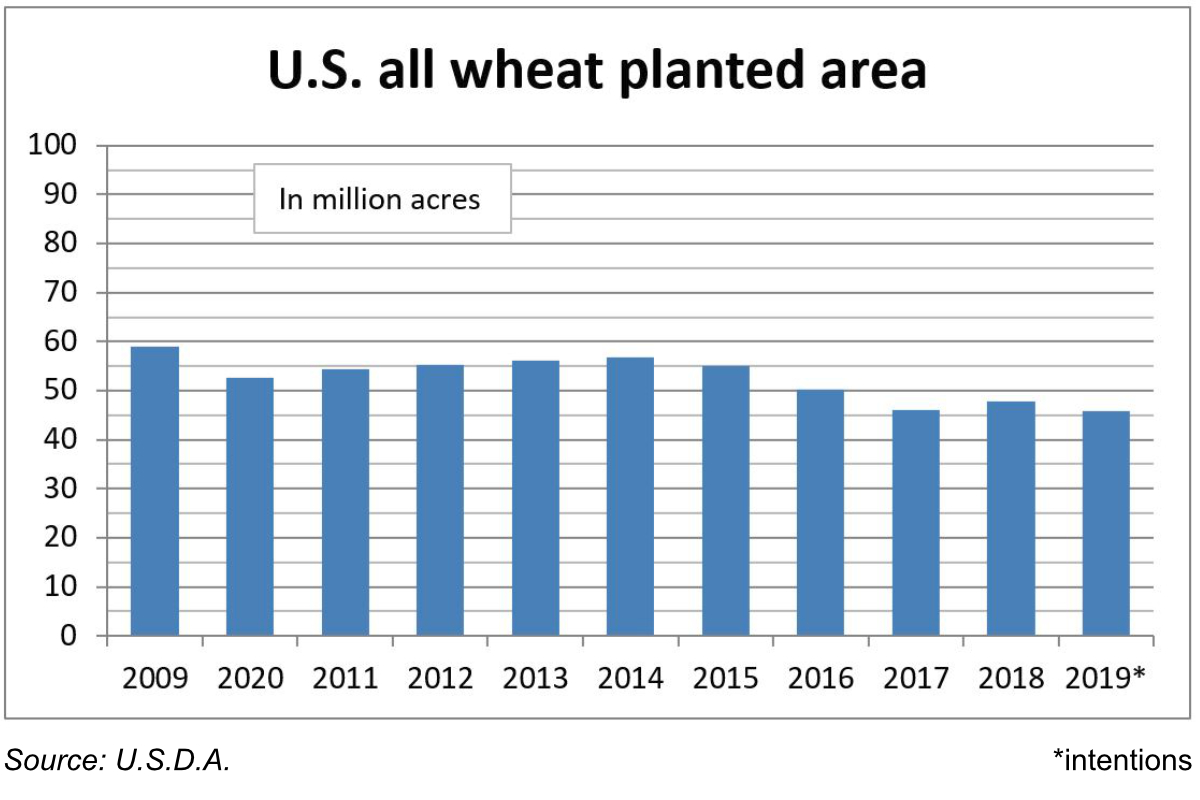
All wheat planted area was projected at 45,754,000 acres, down 4% from 47,800,000 acres seeded in 2018, down from 47 million acres projected by the U.S.D.A. at its annual Agricultural Outlook Forum in February, and the lowest in records that began in 1919.
Winter wheat planted for harvest in 2019 was estimated at 31,504,000 acres, down 3% from 32,535,000 acres in 2018 and the second lowest on record, but up 1% from the U.S.D.A.’s prior estimate. Of the total, hard red winter area was estimated at 22.4 million acres, soft red winter at 5.55 million acres and white winter at 3.55 million acres.
Area planted to spring wheat other than durum was projected at 12,830,000 acres, down 3% from 13,200,000 acres in 2018, including 12.4 million acres of hard red spring wheat.
Durum planted area was forecast at 1,420,000 acres in 2019, down 31% from 2,065,000 acres in 2018.
The U.S.D.A. said farmers intend to plant 92,792,000 acres of corn in 2019, up 4% from 89,129,000 acres planted last year and compared with 92 million acres projected at the Agricultural Outlook Forum, with acreage expected to be up or unchanged from 2018 in 34 of the 48 estimating states.
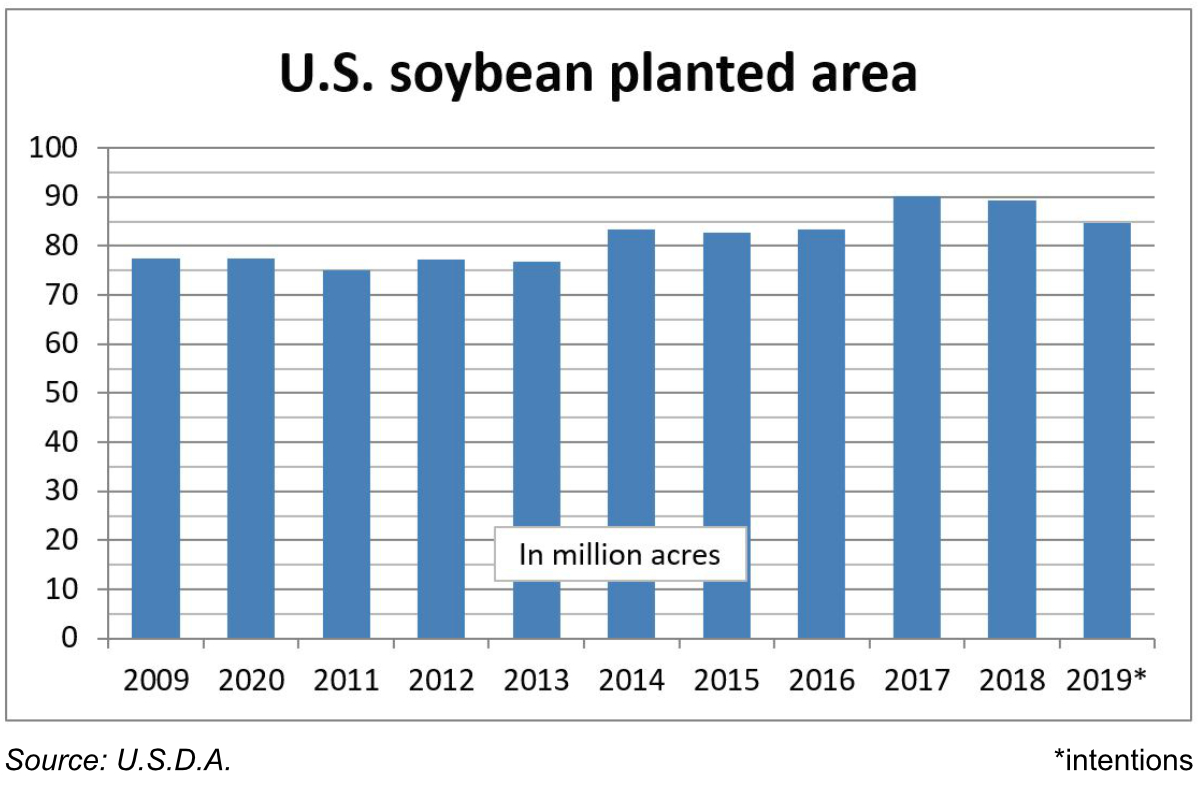
Soybean planted area was projected at 84,617,000 acres, down 5% from 89,196,000 acres in 2018 and compared with 85 million acres projected in February, with acreage down or unchanged in 26 of the 29 estimating states.
The U.S.D.A. all wheat planting intention forecast was below the full range of trade expectations that averaged 46,915,000 acres, with the winter wheat number slightly above the trade average, the other spring wheat number below the trade average and the durum number below the full range of expectations.
The U.S.D.A. corn planting intention number was above the full range of trade expectations that averaged 91,332,000 acres. The U.S.D.A. soybean number was near the low end of trade expectations that averaged 86,169,000 acres.
Corn, wheat and soybean futures all traded lower shortly after the 11:00 a.m. Central Time release of the U.S.D.A. data.
It should be noted that the U.S.D.A. Prospective Plantings survey was conducted during the first two weeks of March, prior to the worst of the flooding in the western Corn Belt and other areas. As a result, some analysts and traders suspect acreage may change considerably by the time actual plantings are reported in the U.S.D.A.’s June 28 Acreage report.