
Three building blocks that ensure simplicity and confidence in your company’s commodity purchases
Commodity procurement professionals face constant challenges with respect to market conditions, price and the timing of their purchases. At the same time, decisions are always evaluated with the benefit of hindsight, which adds to the pressure. In our experience, virtually every commodity procurement team has the same goals – to meet or beat budget, to untangle the complexity of the market, and to make confident decisions based on justifiable data. Here is how risk management specialists from a Fortune 100 company navigate those same challenges and goals.
Simplifying “Economics”
Commodity buyers know that the economic factors that impact price direction are moving targets. Production, consumption, exports and weather are just a few of the factors affecting a commodity market like wheat. Sometimes demand forecasts will drive prices higher while other times a production increase or stocks build will lead to lower prices. Identifying what the main factors are at all times, as well as when they are most applicable, is at best a guessing game.
Let’s look at the Chicago Board of Trade wheat market as an example. So many of the factors affecting wheat prices have strong cross currents. You could have strong exports that have prices at a higher level while current weather conditions are ideal for planting. Which factor takes precedence and how do we quantify it?
In order to comprehensively analyze the economic factors affecting price, we‘ve identified 16 categories that should be considered – note that each factor is given a weighted bearish, bullish or flat rating.
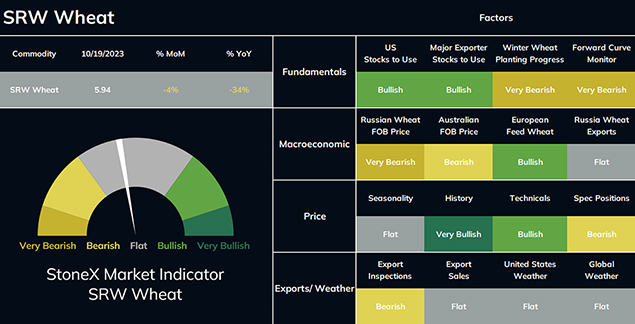 The StoneX Market Indicator highlights 16 key factors for each commodity quantified into bearish to bullish weightings. Source: StoneX Market Indicator, Bloomberg
Identifying “Value”
All commodity markets exhibit strong mean reversion tendencies over time. When prices rise to historically high levels, the high prices encourage more production and discourage demand, eventually driving prices lower. Conversely, when prices are historically low, production is curtailed, and usage tends to increase, ultimately supporting a price rally.
Given this dynamic, we find comparing current price levels relative to past historical periods helps to identify price value and opportunities for purchases.
To identify price value, we have created the StoneX Value Matrix. This is an effective tool that analyzes four years of historical data and distributes it into 10 price deciles. Deciles at the median and lower are defined as the “Value Target” area and represent purchasing opportunities.
The StoneX Value Matrix also provides a bearish/bullish direction on the market. We achieve this by tracking forward prices against the Matrix – depending on where current prices fall within the deciles, we can gauge bullish to bearish market sentiments for these price levels.
Measuring “Momentum”
The “Economics” & “Value” indicators of any market are usually longer-term. Just because wheat plantings are running behind a five-year average or current prices have dropped into lower historical ranges does not necessarily dictate an immediate price move. Those day-to-day price gyrations are trader or momentum driven. Anyone who has ever traded wheat knows that prices can move 5% or 10% is a single trading session, sometimes in a single hour!
The final building block to a strong purchasing strategy is the addition of a tool that identifies market momentum in a shorter timeframe. We utilize Precipice, a proprietary third-party trading system that provides directional trades (entry & exits points). Four timeframes with different analytics and risk parameters are provided. The combination of the timeframes and corresponding proprietary analytics are calculated into a Precipice Index.
Combining “Economics” + “Value” + “Momentum”
Evaluating markets by any of the three criteria we've already discussed can guide good decisions – combining them creates a powerful framework that can transform how you operate. We call this combined framework HedgeMonitor Pro. By combining three asymmetric tools into one final output, a procurement team can leverage structure and clear support to make commodity purchasing decisions with confidence.
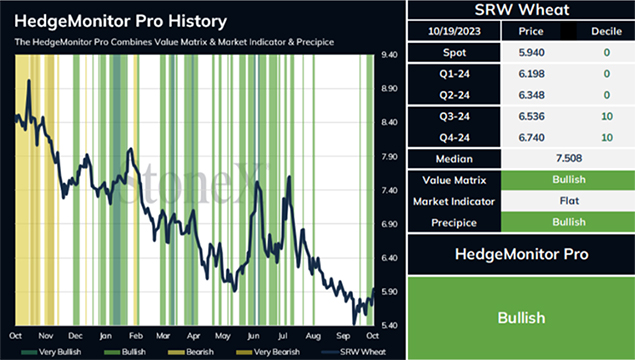 HedgeMonitor Pro combines value, economics and momentum to indicate the current market sentiment impacting any market within your commodity portfolio. Past financial results are not necessarily indicative of future performance. Source: StoneX Value Matrix, StoneX Market Indicator, Precipice Analytics, Bloomberg
Contact the Food & Beverage team at StoneX today for a complimentary view of HedgeMonitor Pro, custom tailored to your company’s commodity price exposure. Email CCC@stonex.com and reference “Sosland Article” in your message.